What powers the Kea Database?
The Kea Database was first launched in mid-2017 as part of a wider citizen science project called the ‘Kea Sightings Project’. Since then, the database has been extended and improved over time—a never-ending process of bug fixing, usability enhancements and data management. Like most modern technology projects, the Kea Database draws on a multitude of different technologies, resulting in a powerful set of features for obtaining, displaying, querying and exporting data. This article seeks to explain how it works and the rationale behind the technology chosen, decisions that were made even more critical by the long-term nature of this project and its data.
 SQUAWK
Yet another online science database?
Before looking at the technology specifics, the question must be answered: why another database? There are already many excellent citizen science initiatives out there, with iNaturalist NZ and eBird already showing hundreds of thousands of observations of New Zealand birds and other species.
The primary reason for building a new platform is that no other system currently provides for the identification of individuals, along with the ability to add profiles and descriptions of each. Kea are a particularly charismatic species with distinct behaviours and human interactions that make them such a highly visible species in the wild. The distinct personalities and different behaviours across birds enables the creation of meaningful and interesting ‘personal’ profiles, an approach less likely to work with less-characterful species.
Nonetheless, as I highlighted in my honours dissertation1 it is very important for projects with a long-term view to consider the ongoing sustainability of the of their databases. Though the dissertation was written after the creation of the database, the sustainability of the database was certainly considered as part of its design.
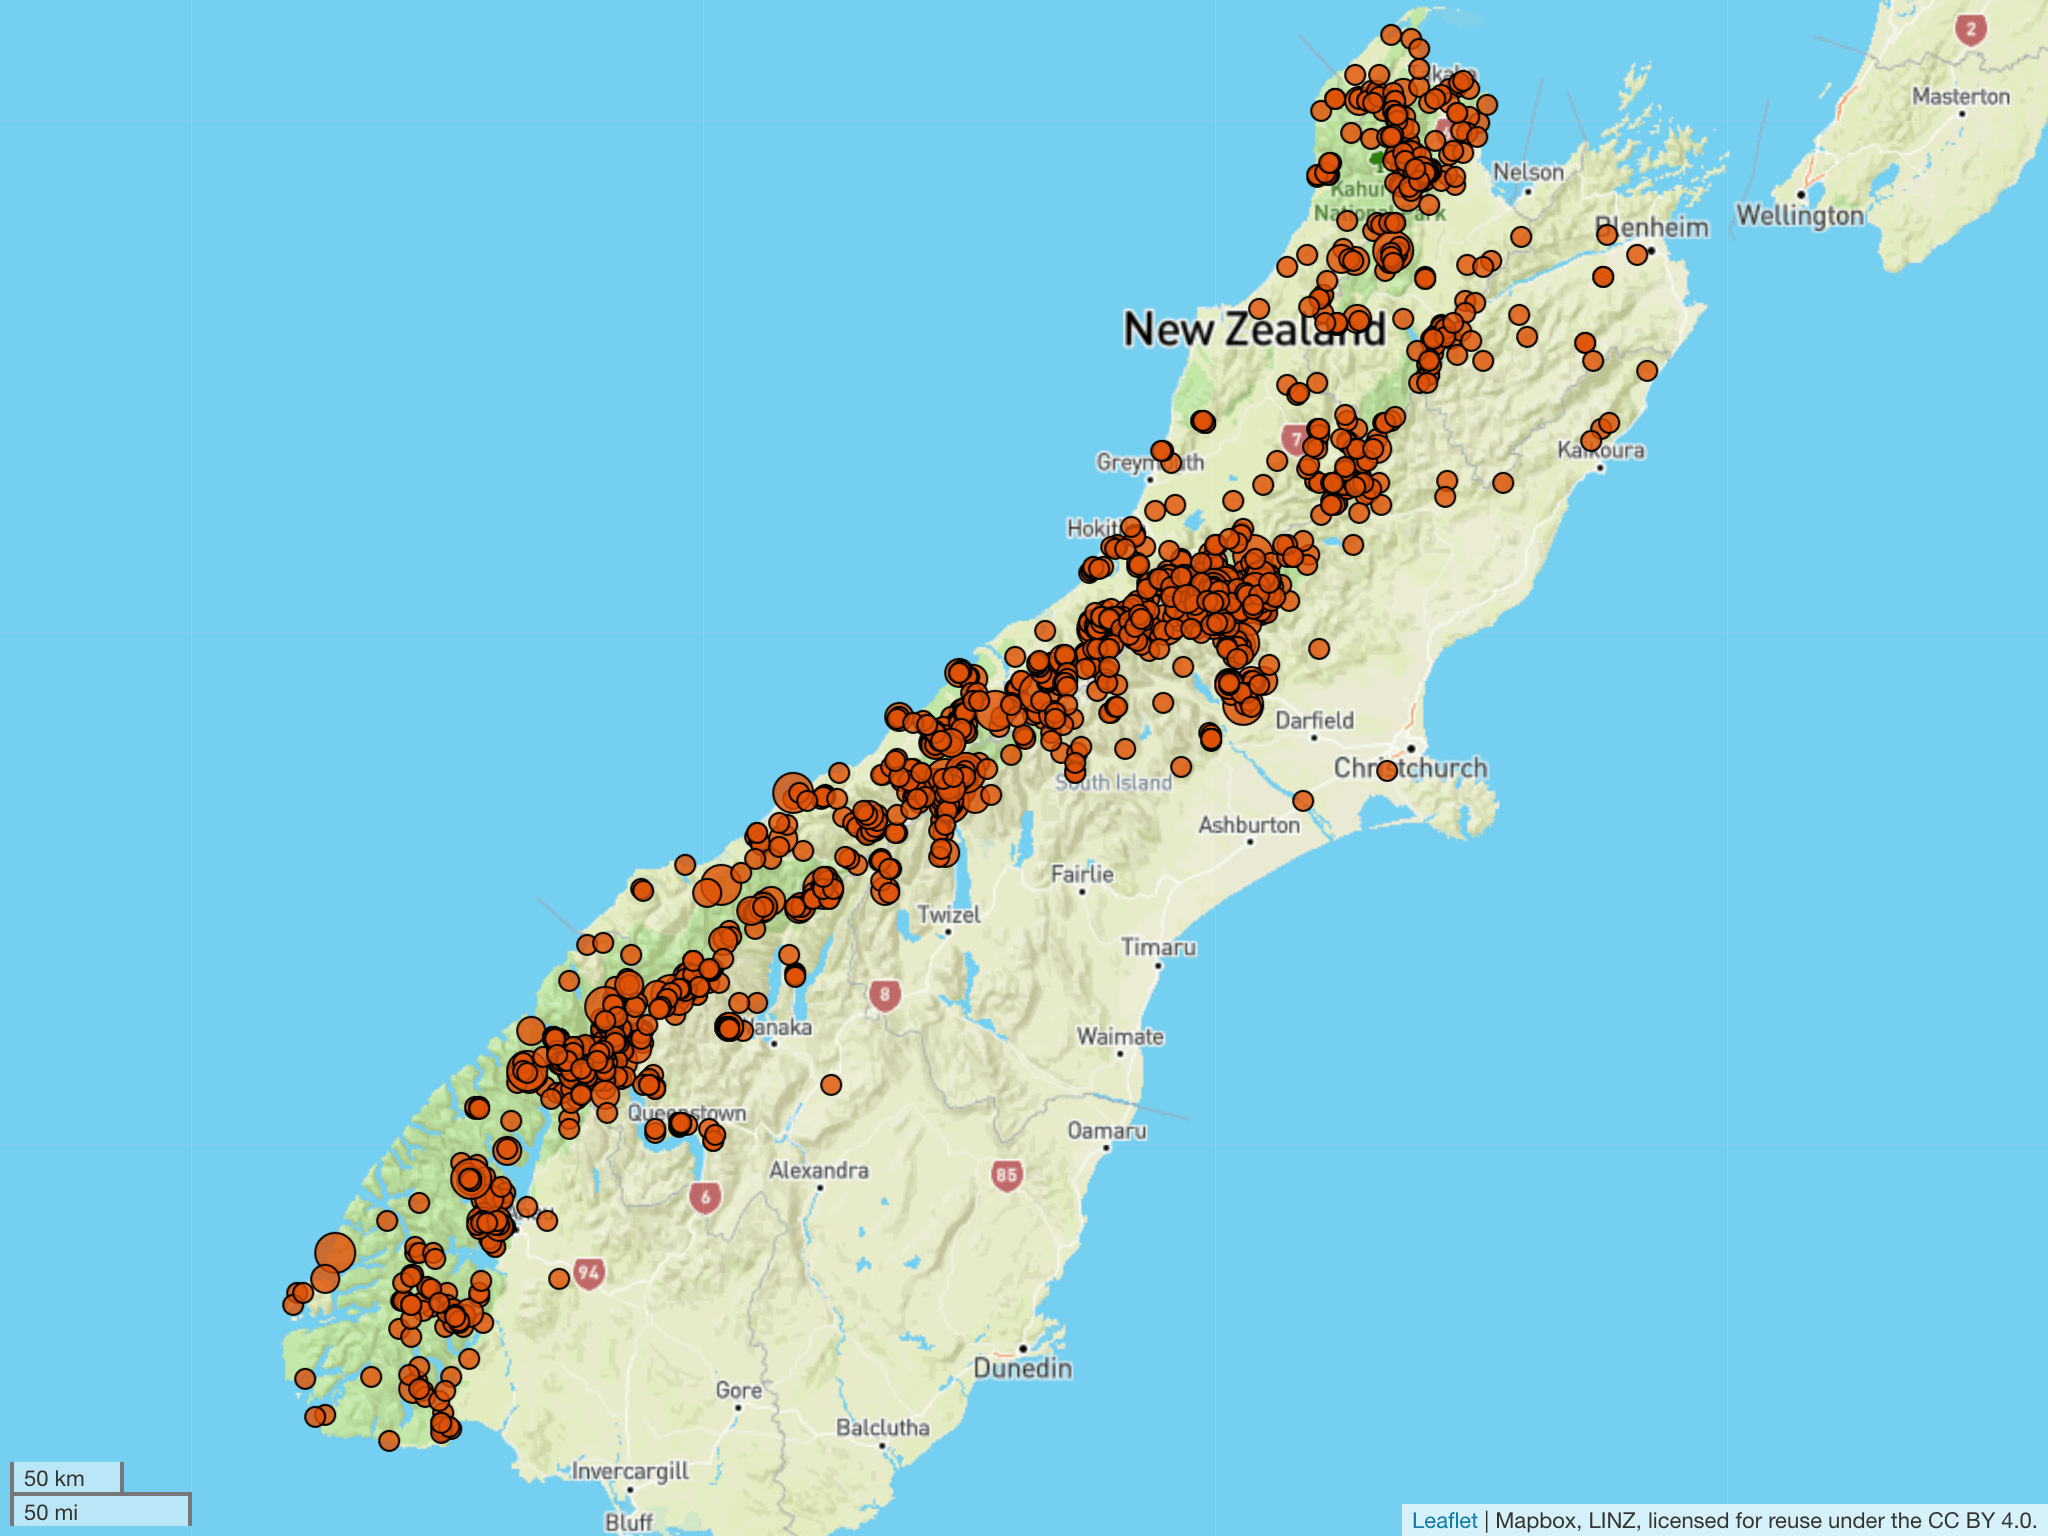 The Kea Database has had over 3500 sightings so far from across the South Island
To ensure the sustainability and longevity of the of the project and its data:
- The project uses mature, stable and well-supported frameworks
This ensures that other developers or future maintainers can continue to support the project. - The project was open source from day one
By open-sourcing the project, the so-called ‘bus factor’2 is reduced in that anyone should be able to immediately provision a copy of the software and associated services should something happen to the maintainer. - The project has had an API from day one
The front-end of the database (what the public sees) has only ever accessed and uploaded data by the same API that any application can use. This is in contrast to other, often older, projects that use a separate interface for accessing and displaying data to a lesser-featured API. - All public data is exportable
Through the API, all public data is viewable via the REST interface in a JSON or CSV format. Hence, should the data need to be imported into another system at some future point, it should be easily achievable.
With these four factors in mind, these should help mitigate the risks associated with running a separate database. In fact, because of these considerations made earlier in the project, the Kea Database is rapidly becoming the location for all kea-related data, including for historical datasets, scientific surveys and data collected through partnerships with backcountry organisations.
Why open source?
The project has been coded using open source technologies exclusively, with the code being released for others to use under an Affero General Public Licence (AGPL-3.0)3. Using open source software was the obvious choice—not only because of the technological benefits, but also because of its basis in collaboration—much like the citizen science nature of the Kea Database.
We were even lucky enough to have our project win the award for the science category in the 2018 New Zealand Open Source Awards, recognising the “natural combination […] leveraging one community to help build another, with mutual benefit.”4 We were delighted with the unexpected award, and naturally had to share it with the resident kea at Willowbank Wildlife Reserve in Christchurch.
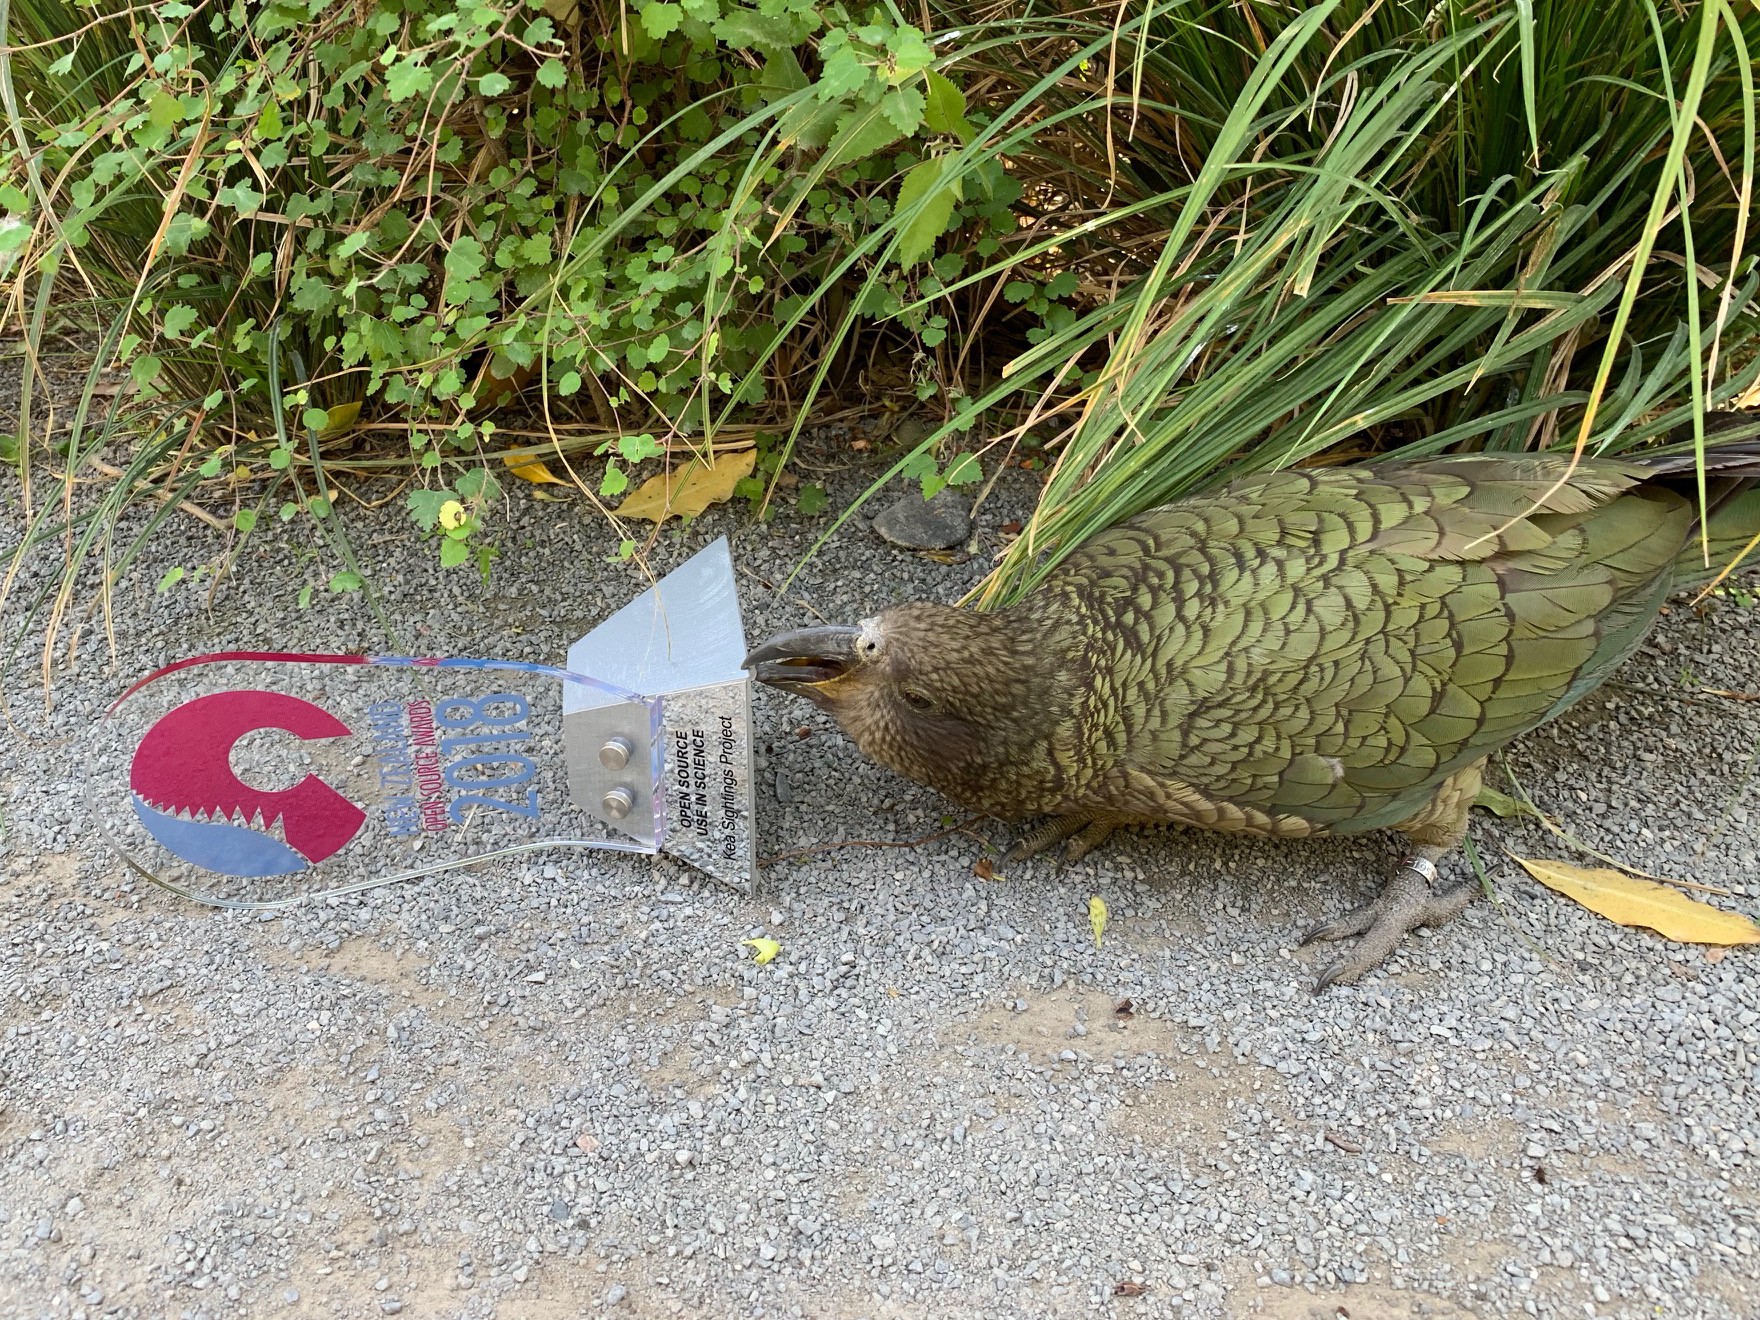 Celebrating our 2018 open source award with a kea at Willowbank Wildlife Reserve
High level architecture
The Kea Database uses a variety of services to provide both moderators and the public with maps, geospatial processing, content-editing tools and various methods of querying and displaying the data. The following diagram aims to illustrate some of the many linkages between these services.
External services are highlighted in green, custom components are in blue, and infrastructure is in orange. Red lines highlight the components that are directly accessible via a URL.
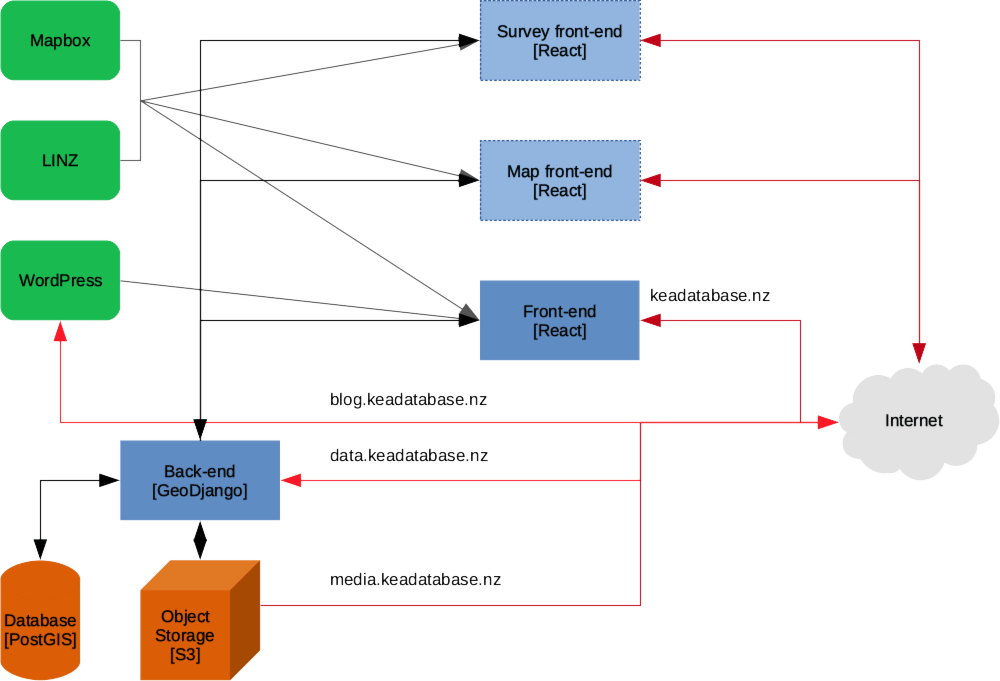 A high-level overview of the various components and services used by the Kea Database
The following sections seek to summarise the technology choices and justifications for the choice of each component.
The back-end
At the heart of of the Kea Database project is Django, a mature Python framework that powers platforms such as Instagram5. GeoDjango is an official version that adds support for handling spatially enabled data. Paired with GeoDjango is the database PostGIS, a spatially-enabled version of the open-source Postgres database.
These two technologies, combined with the excellent ‘Django REST Framework’ and various other Python modules, form the single access point for submitting and obtaining all kea-related information. This central access point is then used across multiple services, including the main website, a special map and a new survey tool for the Department of Conservation.
What does it do?
- Provides the GET API endpoints for all 1500+ kea in the database and associated band combos, including querying and sorting.
- Provides POST API endpoints for reporting observations and surveys.
- Provides GeoJSON endpoints for direct view and analysis in tools such as QGIS, or displaying on web maps.
- Interfaces with Amazon S3 object storage and CloudFront caching for image storage. Automatically processes uploaded images into multiple sizes suitable for use on the web.
- Automatically allocates uploaded sightings to a particular geospatial region and reverse-geocodes them to the nearest named feature to enable easy dataset browsing and moderation.
- Provides a secure administrative interface for moderating sightings and updating/editing information.
- Imports raw data from the Department of Conservation’s internal Access-based kea database through repeatable and structured scripts to ensure both datasets are synchronised with each other.
- Enables the import of suitably formatted sightings data from other sources via CSV.
Why these technologies?
The combination of GeoDjango, PostGIS and Django REST Framework was a no-brainer given the hugely powerful feature set and community-backed modules. This decision has enabled complex functionality to be rapidly built, whilst retaining relative simplicity in the source code. Django also has a great testing framework and a well-defined process for its updates and deprecations, all contributing to project maintainability.
The front-end
The front-end is predominantly built using modern (ES6) JavaScript. In the ever-evolving world of JavaScript frameworks6, it was difficult to determine what framework would be best suited to this project. At the time, Google-backed Angular and Facebook-backed React were the two most common frameworks being talked about, but after trialling both, React stood out as being simple in execution, but powerful with its components-based approach. I suspect either framework would’ve been a good choice, but React continues to be excellent to use, with a strong set of community-created libraries enabling the easy addition of complex functionality.
Having little experience in modern JavaScript, building the database was also an excellent opportunity to force upskilling and learning ES6—it might’ve taken a bit longer to build at the time, but it has paid-off in the long run both for personal learning, and also being easy to extend and maintain. The increasing browser support of Progressive Web Apps7 also bodes well for the creation of lightweight offline functionality should it be required in the future.
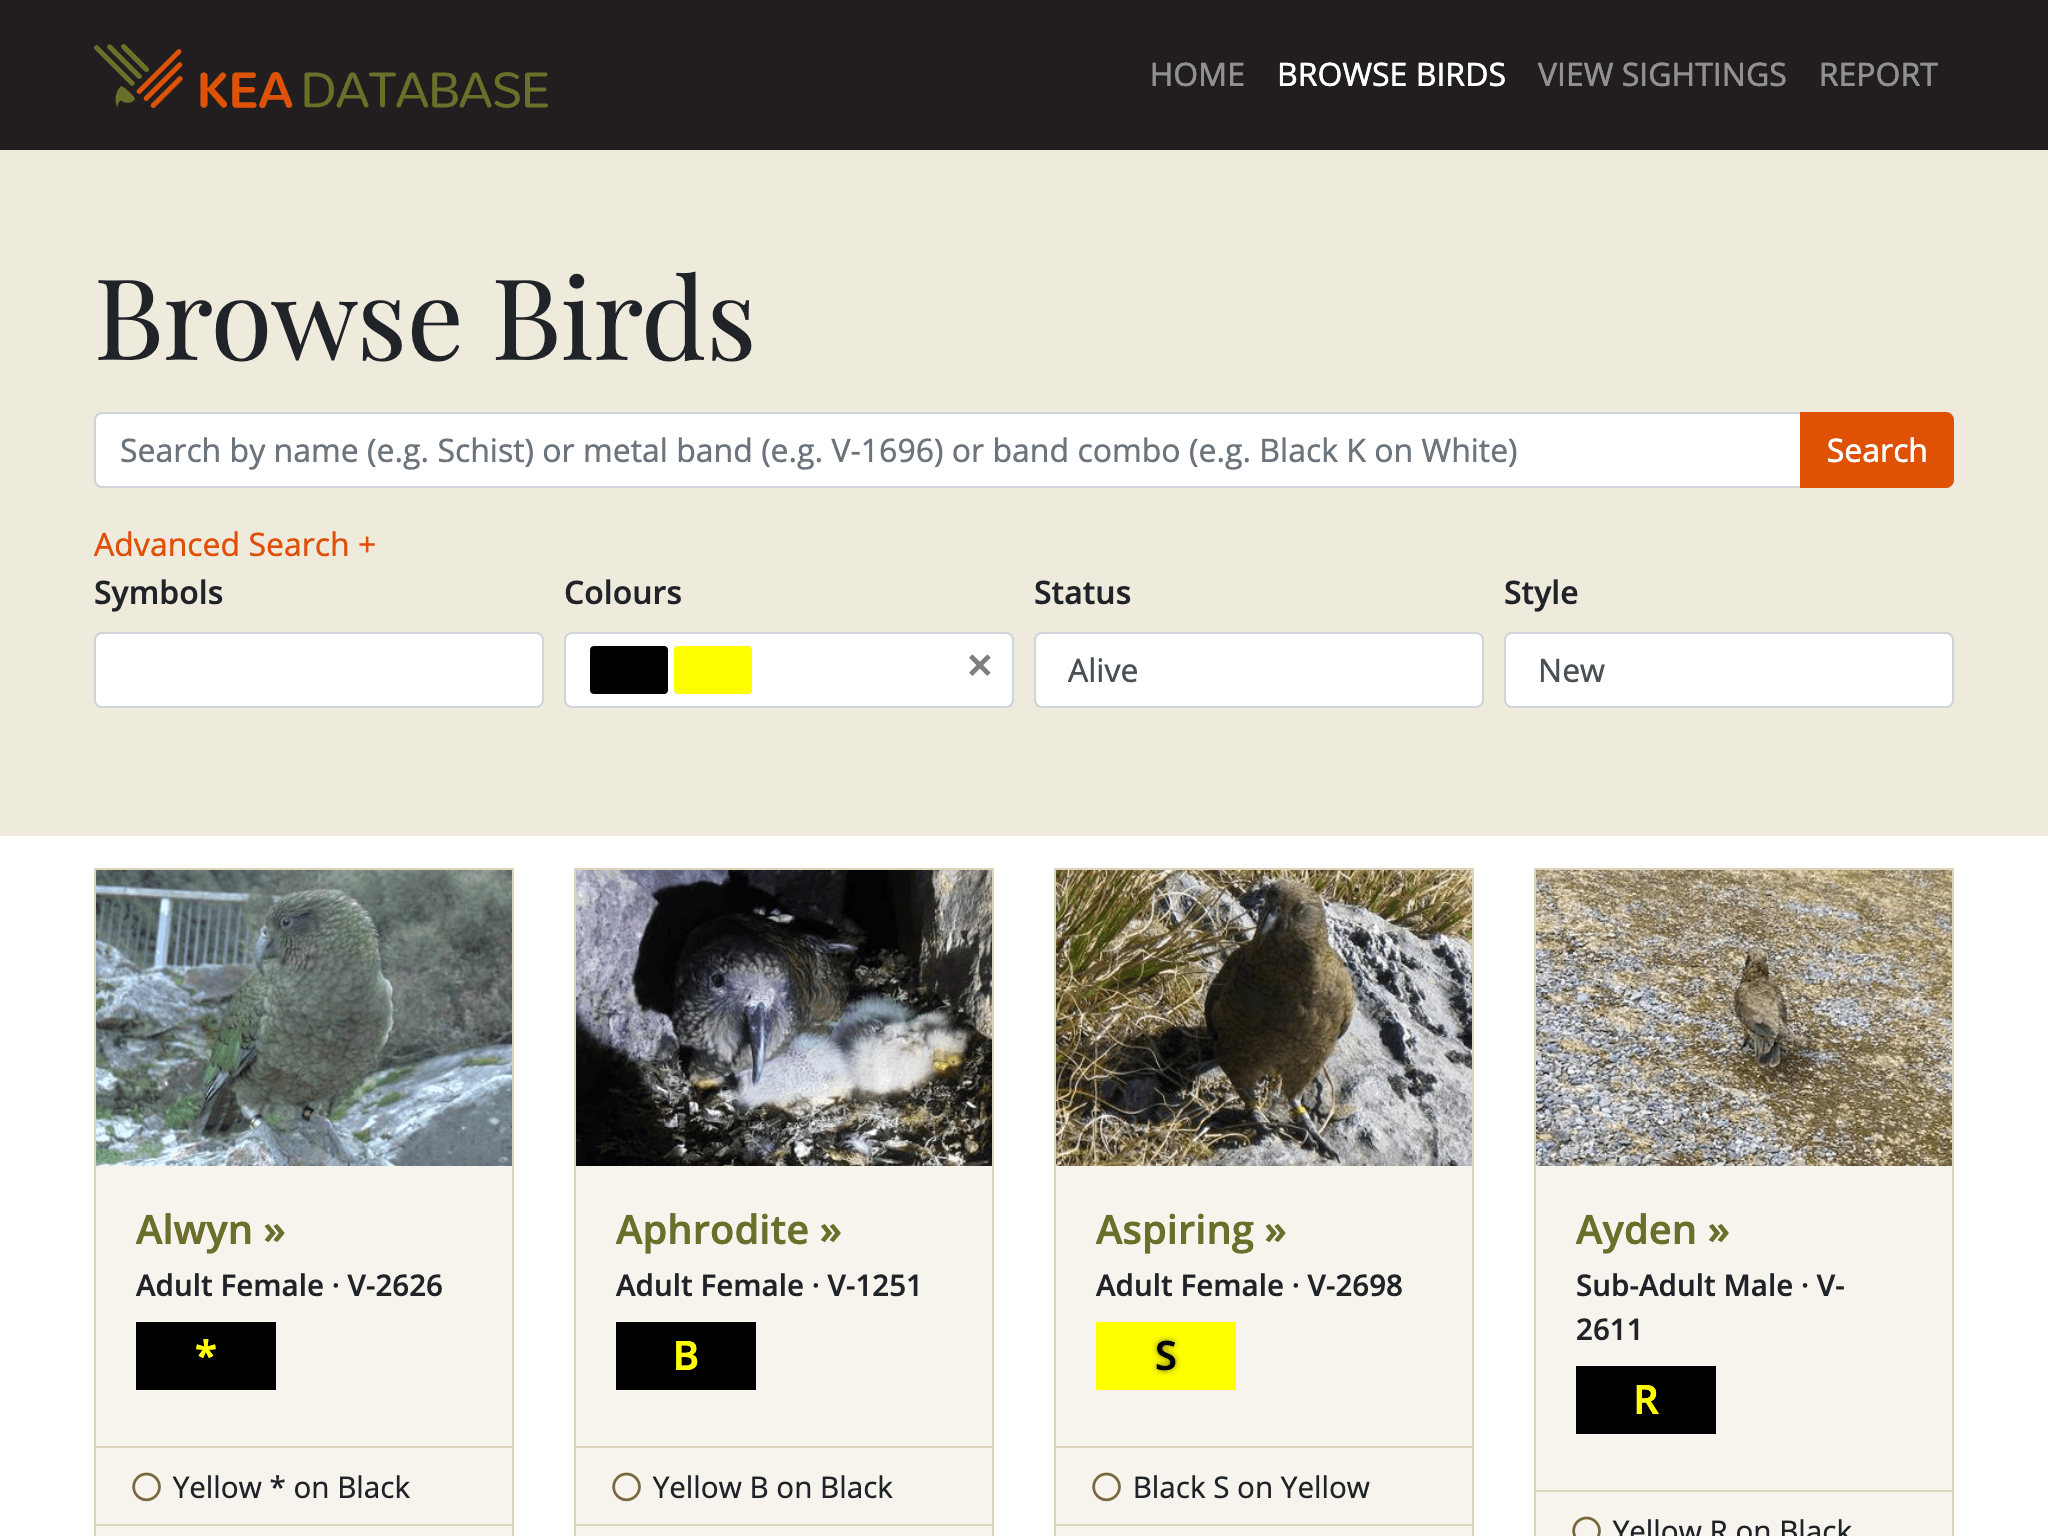 The ‘Browse Birds’ page showing search features and band visualisations
The initial version of the front-end of the Kea Database was ultimately rewritten8 after about a year, using a different mapping library, leveraging the lessons learned from the first version and also taking advantage of now-mature technologies such as Bootstrap 4. Presently the predominant technologies used are React, Redux, React Router, SCSS & Bootstrap 4, Formik, Yup and the excellent create-react-app tool for easy code transpilation. The front-end currently uses mapbox-gl for the mapping elements however after some successful testing this will likely be changed to the open-source Leaflet library.
What does it do?
- Presents the main interface by which the public interacts with the database and upload sightings.
- Enables the database to be easily accessed across a variety of devices from mobile to desktop.
- Provides the means to browse a map of sightings, as well as individual birds and their sightings.
- Automatically creates visualisations of band combos to improve usability and identification of individual birds.
- Connects to the WordPress.com API to provide administrator-editable help pages, home page text and recent blog posts.
Why these technologies?
As mentioned, it was a bit of a toss-up for deciding on the JavaScript framework to be used, but so far React has proved to be an excellent choice. As much as possible, only well-documented and actively maintained libraries have been used to ensure ongoing maintainability.
Hosting
Hosting has long been a bugbear of the various projects I have been involved with—there are certainly cost advantages to hosting everything on a $10/m VPS on the other-side of the planet, but equally this comes with issues such as latency, as well as having a whole stack of components to maintain and backup. After six years of maintaining my own SaaS product for high schools, I was not keen on having the mental overhead (albeit slight) of having to manually maintain systems, nor was I keen on having to create a whole set of monitoring and automation infrastructure—both routes I’d tried in the past.
How is the database hosted?
Whilst a Kubernetes-style container approach may yet solve many of my problems, in May 2017 application platform Heroku seemed like the easiest option for the database back-end. After some slight rearrangements of the Django application layout and the wrangling of some ‘buildpacks’ to enable the necessary geospatial libraries, a simple git command was all it took to deploy to production. Heroku sorted all of the necessary rollback features, auto-renewing SSL certificates and various performance metrics. Secrets are simply stored in environment variables on the Heroku administrative interface and all of the Kea Database data is stored in either object storage or a managed database enabling easy backups.
Heroku is not without its problems, the main two being cost and performance. The cost is probably at least twice what it might be if I were managing the infrastructure myself, and the performance could be improved—for example there is presently no caching on at the back-end level. Normal protocol for hosting a Django app might be to put it behind NGINX, but for Heroku that would be a separate chargeable service.
The front-end is entirely static, and therefore very simply hosted on Amazon’s S3 object storage, with a CloudFront layer handling caching and SSL certificates. A one line deploy command in package.json for the various front-end packages means a deploy only takes a few seconds—no maintenance required.
As an aside, code submitted as a pull request automatically undergoes some checking on Travis CI, who offer free services to open source projects. The front-end presently has no testing, but is checked for code consistency. The back-end presently has some unit tests which are run, with a code coverage report being produced.
What next for hosting?
The current hosting approach has been working OK for the last couple of years, but there’s a few issues to be resolved:
- Data sovereignty
Data sovereignty is an increasingly important and relevant consideration with the ever-increasing amounts of data collected around the world. Whilst perhaps not so significant for non-personal data such as on the Kea Database, on principle the data should be stored in New Zealand. - Performance
As more data gets added to the database and its functionality is extended, the performance constraints of the current hosting arrangement are becoming increasingly clear—there’s only so much database query optimisation that can be done. Adding a caching layer and increasing the available computing power would be immensely useful, but it is presently cost-prohibitive to do so. - Cost
Presently the per-month cost of the database is high, especially given the current performance constraints. Ideally the hosting would be moved to a a more flexible service, or potentially even to a service offering free hosting and maintenance for non-profit organisations.
All of these issues need to be resolved in due course, so long as the primary goal of easy ongoing maintenance and backups is considered. I don’t yet have an answer to these issues, but there’s some promising work in the containerisation space and potential sponsorship arrangements in the works.
External services
The Kea Database leverages a number of external services, either to reduce cost or complexity.
Mapbox
The first version of the Kea Database used Google Maps for the mapping aspects of the database, however at the time the underlying basemaps were not well-suited to placing points outside of areas with clearly defined features. It was initially selected as it had a generous set of tile requests available for free.
Mapbox was selected for the second iteraction of the Kea Database front-end, as its pricing model changed to provide a generous free tier. Mapbox is used to provide an ‘outdoors’ style basemap, and a library called mapbox-gl which powers the maps on the main Kea Database front-end.
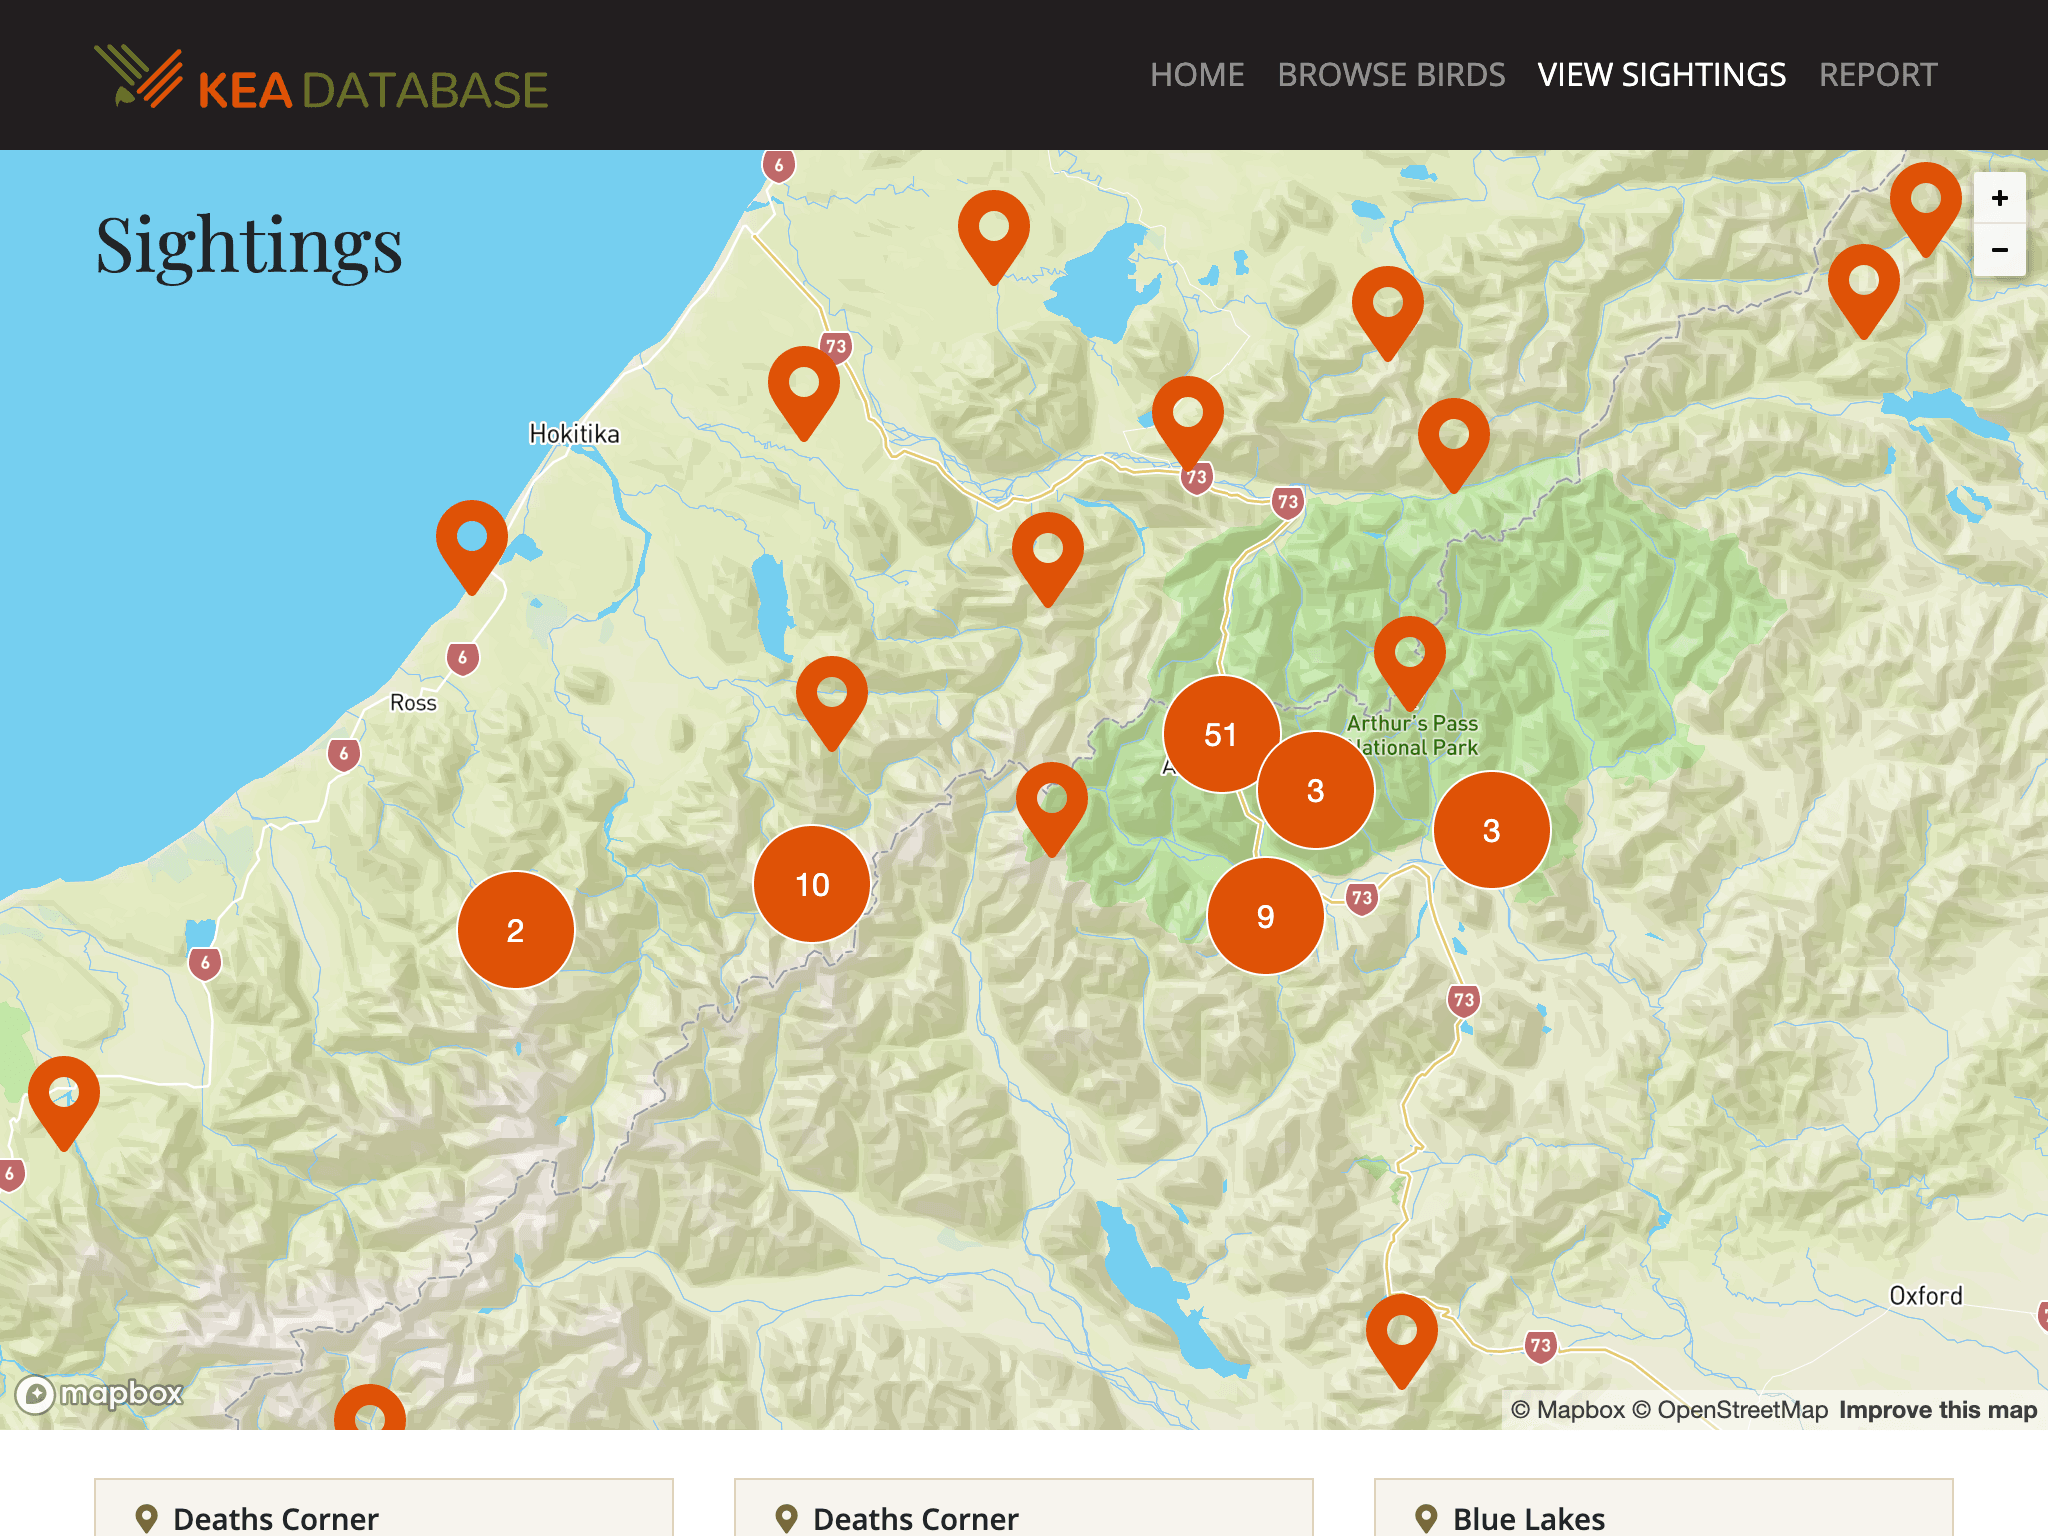 The ‘View Sightings’ page with the Mapbox outdoors basemap
The mapbox-gl library, whilst powerful in some aspects, proved to be quite limiting in other aspects—for example, it does not have a library of community plugins like other popular open source mapping libraries do.
The mapping library Leaflet has been trialled elsewhere with good effect, so it is likely that the main Kea Database will be switched to this at some point. Fortunately, Leaflet can be used with the underlying Mapbox outdoors basemap provided through a standard Tile Mapping Service interface.
LINZ
Beloved by trampers and outdoor enthusiasts everywhere, the New Zealand Topo50 maps are almost certainly the most used and recognisable map series for any backcountry navigation. As such, their inclusion on the mapping interfaces of the Kea Database rapidly became a ‘must-have’ feature.
Land Information New Zealand (LINZ) helpfully provides an online data portal9 with thousands of layers of data, one of which is a combined layer of the Topo50 series of maps. After searching for various solutions for hosting the tiles, short of generating and hosting them ourselves the data portal’s provided Tile Mapping Service (TMS) quickly became the obvious choice—as a standard, it was fast to implement. Despite some vague wording10 around what ‘reasonable use’ rate limiting, so far this has been a great solution—Topo50 map tiles now automatically appear when the map is zoomed in to a suitable level. If for some reason the rate limit is exceeded, the map simply degrades to the underlying Mapbox basemap.
WordPress.com
The need for a simple content management interface became apparent in the early days of the project. Not wanting to clutter up the Kea Database back-end with content management functionality, WordPress.com was a cheap, simple and performant choice.
WordPress.com provides a simple REST API, enabling the Kea Database front-end to make a simple API query to pull across all relevant data for the home page, the various footer pages and blocks of text elsewhere around the site. Naturally, it also provides a great blogging interface and as a managed service implementation of an open source product, there has been zero maintenance required.
Essentially: it just works!
Google Analytics
Google Analytics is a widely used tool for helping understand how websites are used. We use it to find out how users are getting to our site (e.g. directly, searching, social media), how long they’re spending and what they’re doing there. Analytics are also good for determining how people view the site—for example, more than 56% of visits in 2019 have been using a mobile device, highlighting the importance of ensuring a good experience on small screens.
What’s next?
Like all good software projects, there’s a continually updated backlog of features and bug fixes that get addressed as time allows. Currently on the cards is a project building a survey tool for the Department of Conservation, with the goal of creating a long-term dataset in a more rigid scientific framework to enable increased understanding of kea population numbers. Independently, there is a separate mapping interface being developed to enable the import and display of a number of sightings done by a non-profit community organisation that has a partnership with the Kea Conservation Trust. Due to the flexible architecture of the database, building new interfaces is relatively trivial, each interacting with the data through the common REST API.
There are also many improvements to the main Kea Database itself in the works, such as refinements to the user interface of the sightings form, public image uploading and improving the behaviour of searching. However, despite hundreds of hours of work the backlog never seems to get smaller!
In summary
The goal is that the above notes are of interest for anyone seeking to build a similar service or use the open source Kea Database code11, but if nothing else, hopefully this article will be useful for any future maintainers of the project. Feel free to direct any queries or advice to me on social media or elsewhere.
As always, by their very nature community projects are always more than just the work of one individual—I’d like to acknowledge the hard work of my project co-conspirator, Dr. Laura Young, for her dedication to all things kea. I’d also like to acknowledge project co-founder Mark Brabyn, who is now pursuing other projects.
Laura and I are also very thankful for the continued support from the Kea Conservation Trust, the Arthur’s Pass Wildlife Trust and the Department of Conservation. Equally, we’d like to mention our many brilliant project sponsors, such as Active Adventures, whose ongoing support for the project is gratefully welcomed.
Footnotes
-
https://georgemoon.com/2018/02/community-conservation-data-in-new-zealand/#sustainability-of-databases ↩
-
https://nzosa.org.nz/ (quoted from the awards booklet) ↩
-
https://instagram-engineering.com/web-service-efficiency-at-instagram-with-python-4976d078e366 ↩
-
https://stackoverflow.blog/2018/01/11/brutal-lifecycle-javascript-frameworks/ ↩
-
https://en.wikipedia.org/wiki/Progressive_web_applications ↩
-
I rewrote the database front-end with support from Satoshi at Catalyst IT, for which I’m very grateful for! ↩
-
https://www.linz.govt.nz/data/linz-data-service/guides-and-documentation/rate-limiting ↩
-
https://github.com/greenstone/keadatabase-back and https://github.com/greenstone/keadatabase-front ↩